
- by Team Handson
- September 26, 2022
Data Science Interview Questions Part: 1
Data Science
Data Science is an interdisciplinary field that incorporates Physics, Mathematics, Statistics and computer Science. Data Science transformed the raw data into an ordered sequence to get the correct variable. The probable contents of Data Science are SAS, Python, R Programming, SQL, Data Visualization tool etc.
Data Science has become a trendy job opportunity for the fresher since last few decades. It has become the most popular genre because of its data analytical power as data will be the main thing in the upcoming future. Data Science is used in our present daily life with the use of trendy technology. The common examples are the food delivery applications, the online vehicle booking application along with the usage of maps for pointing the locations. It is also used in the applications like Amazon, Flipkart with the best recommendation for the product according to the customer’s choice depending on the last search of the customer. Data Science has also become popular for the fraud detection application for the security of the customers.
Best Interview Questions for the Fresher of Data Science:
1. What is Data Science and describe the life cycle of Data Science?
Data Science is an interdisciplinary field that transforms the raw data into an organized one using the statistical and mathematical analysis. This incorporates scientific processes, algorithms, many scientific tools and the machine leaning process etc. to build predictive models.
Life Cycle of Data Science:
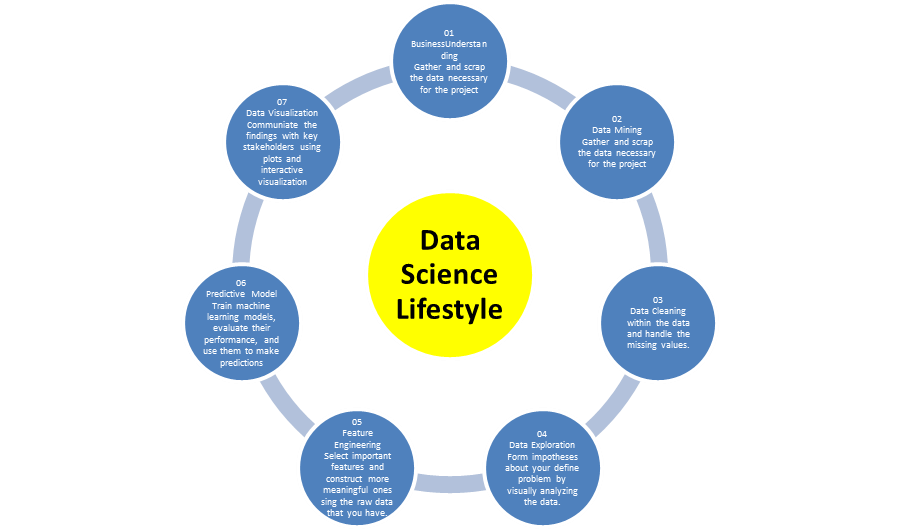
The journey starts with the process of gathering relevant data along with the business requirements.
The gathered data has to go through the process of Data cleaning, Data warehousing, data staging and data architecture.
To create the summary of the perceptions, the collected data is processed to complete the piece of work for exploring data, mining the data, the process of analytics.
The process of investigation the cleaned data is concerned to different algorithms like predictive analysis, regression, text mining etc. as per the requirements.
The final stage brings the final results of connecting or communicating the business with a visual appeal. In this final results the skill of reporting and data visualization are come to the fore front.
2. Is Dimensionality reduction is good before fitting to a support Vector model?
Dimensionality reduction ameliorates the SVM that means the Support Vector Model when the feature number is bigger than the observations.
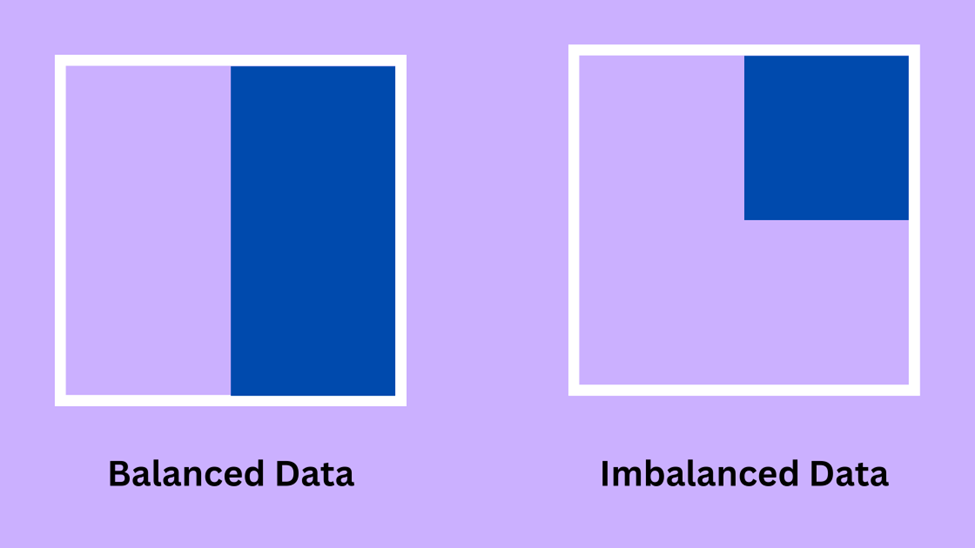
3. What is imbalanced data?
If a data set contains a largely different positive and negative value is called imbalanced data set. It is very imbalanced due to its inequality over the different categories. And these data sets contain error during the time of presentations.
4. What is the difference between Data Analytics and Data Science?
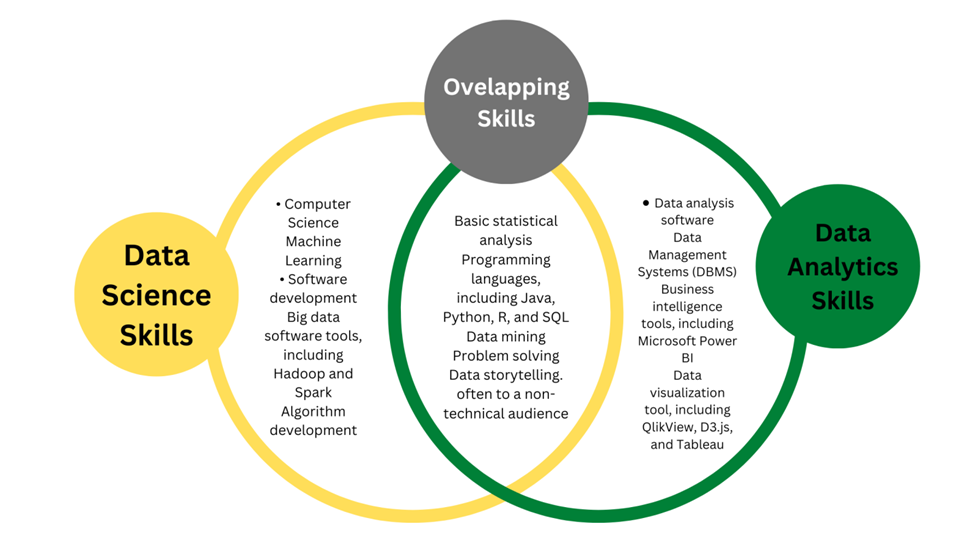
- Data Science transforms data by using many technical analytical methods to bring a reasonable perception and this data is used by data analyst for the application of the business.
- Data Analysis reuses the already existed hypothesis for the betterment of the business with an effective decision.
- Data Science brings innovation and a new insight by solving the problems to make a clear connection the probable problems of the future.
- Data Science is a broad term that incorporates many scientific tools along with the mathematical algorithms for solving some critical issues. But Data Analytics is a specific genre of study where specific problems are solved with the help of specific tools of Statistics and Data Visualization.
5. What is computational graph?
Computational graph is ‘’Dataflow graph’’ where it is in the Tensor flow to create a network of nodes and every nodes works systematically. In a graph of nodes represents operations whereas the edges suggest tensors.
6. Can the result of Categorical variable be better than Continuous Variable in the Predictive Model?
A categorical variable can be treated as two or more variables; there is no specific category for this thing. Both Categorical Variable and Categorical variable are almost the same with the perfect and intelligible ordering defines. Therefore if the variable is ordinal then the result of the categorical value of a continuous variable would be formed in a better Predictive Variable.
7. Give some idea about the Test Set and Validation Set?
The Test Set is utilized to evaluate or experiment the presentation of a trained model that evaluates the power of prediction of a model. It is a part of the training set that makes use of select the parameter to evade over fitting.
8. Which is a better option between random forest and Multiple Decision trees?
Obviously Random Forest is better than the multiple decision trees. Random forest is much more strong accurate and the chances of over fitting are less. This is a more organized process to certify many weak decision trees to learn the things strongly.
9. What do you think that Data Science interviews are hard to crack?
The direct truth is that to crack the data science interview is really hard. It hard because Data Science is a new genre and new concepts are developing every day. Therefore a proper grip of knowledge and the confidence level can only satisfy the interviewer.
10. What are the differences between expected value and mean value?
The difference between expected value and the mean value is not a significant one. Mean value suggests the distribution of the probable values but the expected value shows the contexts with the random variables.
11. What is the difference between the long format data and the wide format data?
|
Long Format Data |
Wide Format Data |
|
Each row of data has one particular subject information or fact and each subject would have its data in multiple rows. |
In this case the Repeated facts or the responses of a subject are the part of the separate column. |
|
We can identify the data taking the rows as groups. |
We can identify the data taking the columns as groups. |
|
Long format is used to in R programming to analyze and write into the log files after each and every trial. |
Wide format data is seldom used in the R programming and that is greatly used in stats packages of repeated measurements of ANOVAs. |
12. Clarify the meaning when the value of P is high and low?
A P value evaluate of the probability to get the ultimate result or outcome that is equal to or more than the achieved results under a particular hypothesis taking the assumption of the null hypothesis is correct. This show the chances of the previously surveyed distinction happens randomly at a chance.
- Low P value means less than or equal to the measure of 0.5 where the null hypothesis can be put aside and the data is not equal to the null.
- High P value means greater than or equal to the value of 0.5 where the power is in commendation of the null hypothesis. This actually shows that the data resembles to the null.
- When P value is equals to 0.05 that means the hypothesis can go in any way.
13. What is confounding variables?
Confounders rather confounding variables are such a kind of extraneous variable that gets an impact on the dependent and the independent variables originating a false assimilation and mathematical relationship between those two variables which are related but connected logically.
14. Discuss about the idea of Auto encoders?
Auto encoders are the learning encoders that transform the input from the output controlling a minimum level of errors. Therefore the output becomes same or identical with the input.
There are multiple layers and the output layer is smaller then the input layers. These inputs are taken as to rebuild the later input.
15. What is Survivorship Bias?
This is an immortal time biasness that suggests for the logical error during the focus on various ideas that make some process and rejects those processes that failed to do any work for the scarcity of reputation.